 Open in Desmos ↗
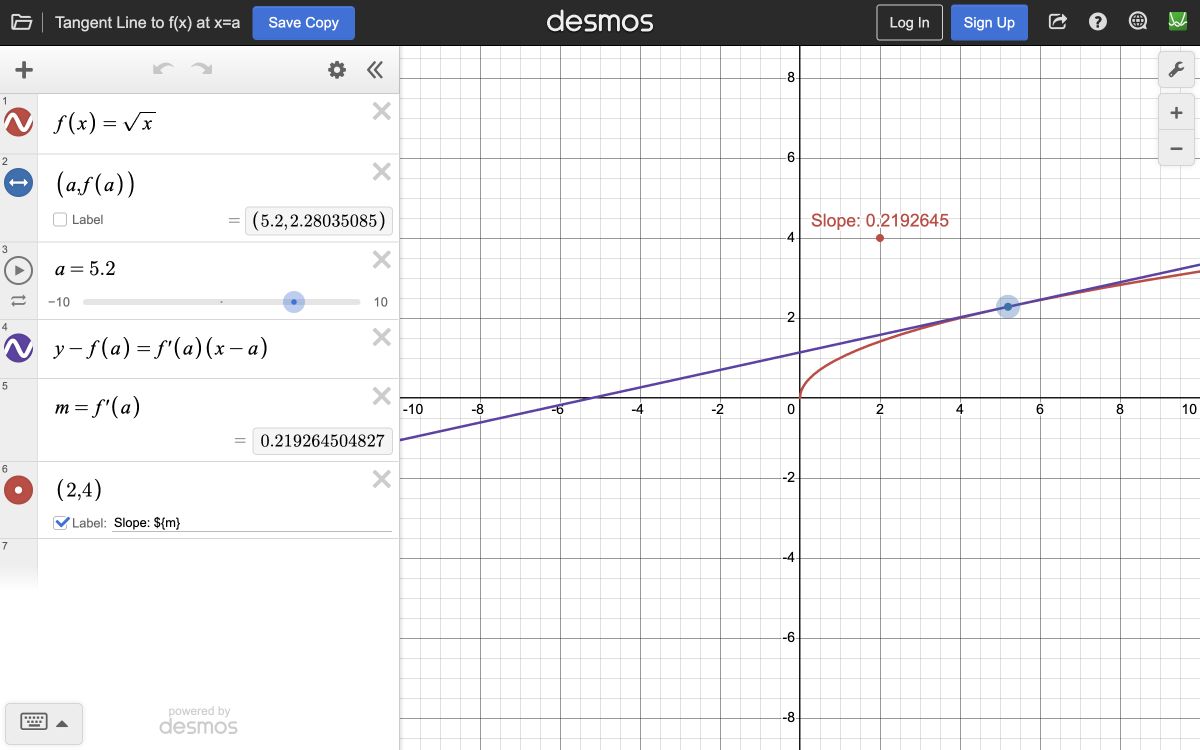
Tangent Line to f(x) at x = a
Move the point of tangency and connect the derivative to the slope of the tangent line.

.svg.png)

Interactive graph collection
Open in Desmos ↗Move the point of tangency and connect the derivative to the slope of the tangent line.
 Open in Desmos ↗
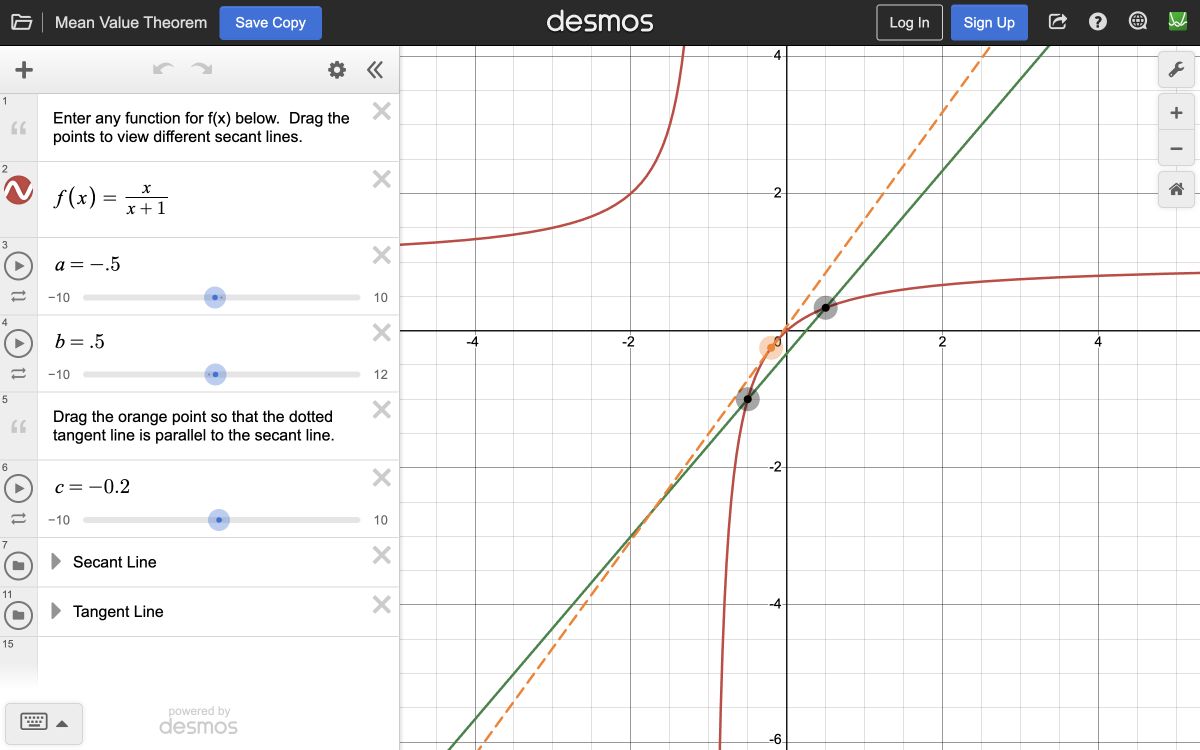
Compare an interval’s average rate of change with the matching instantaneous rate of change.
 Open in Desmos ↗
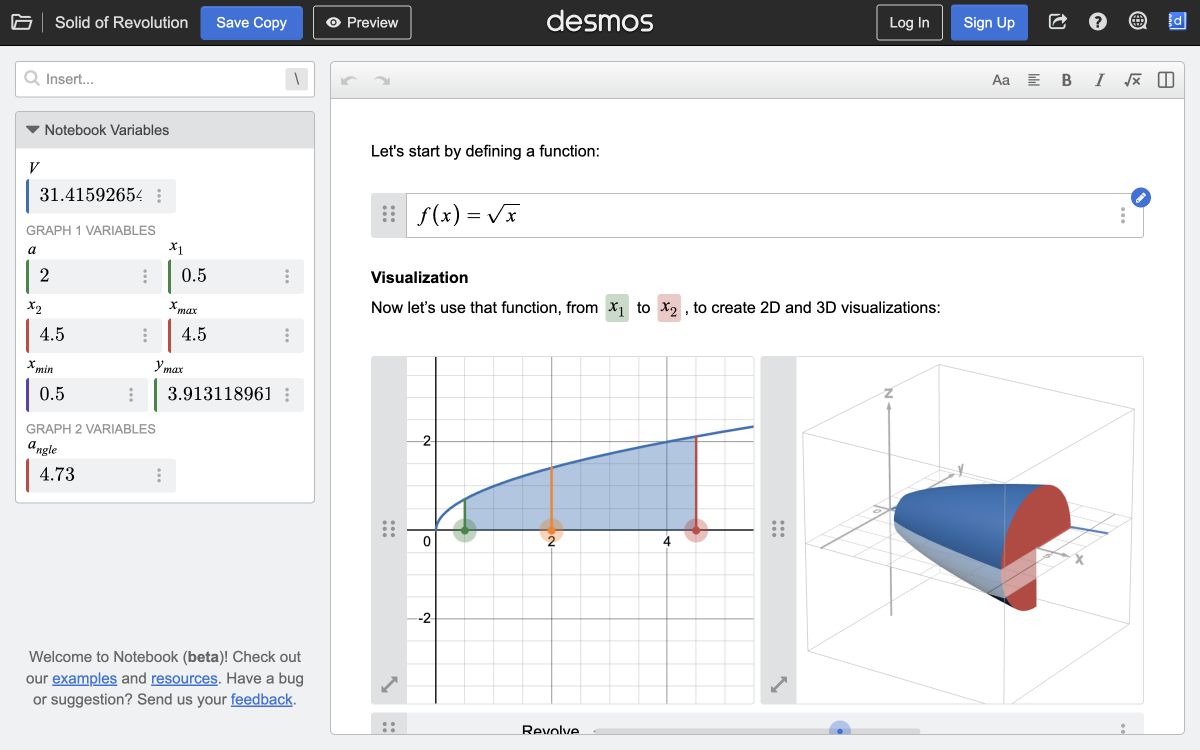
See a two-dimensional region become a three-dimensional solid through rotation.
 Open in Desmos ↗
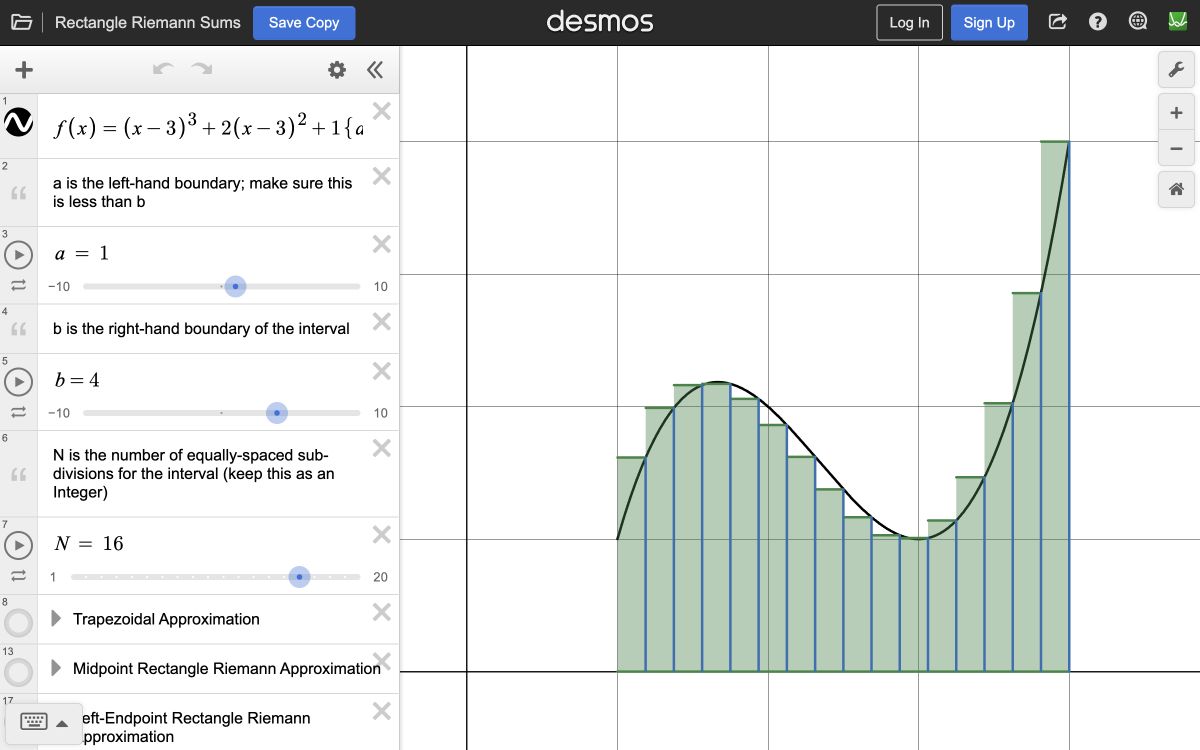
Adjust the number of rectangles and watch an area approximation become more precise.
 Open in Desmos ↗
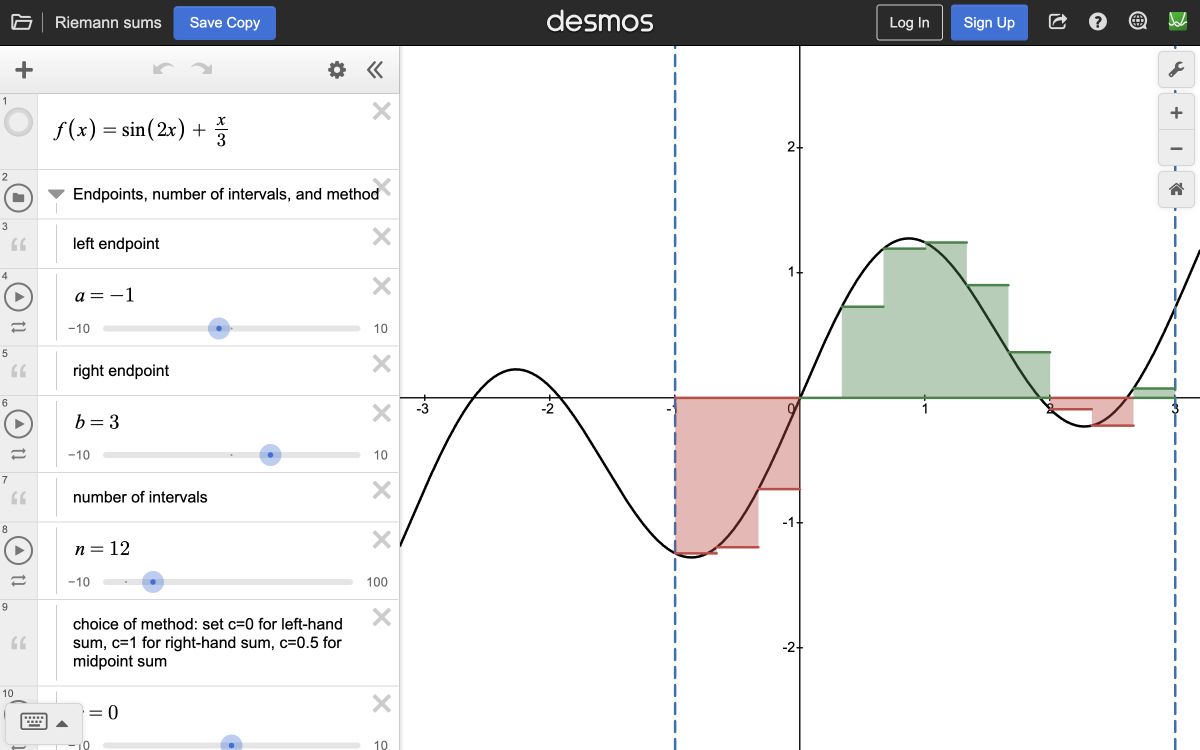
Explore rectangular approximations and the role of signed area in a definite integral.
 Open in Desmos ↗
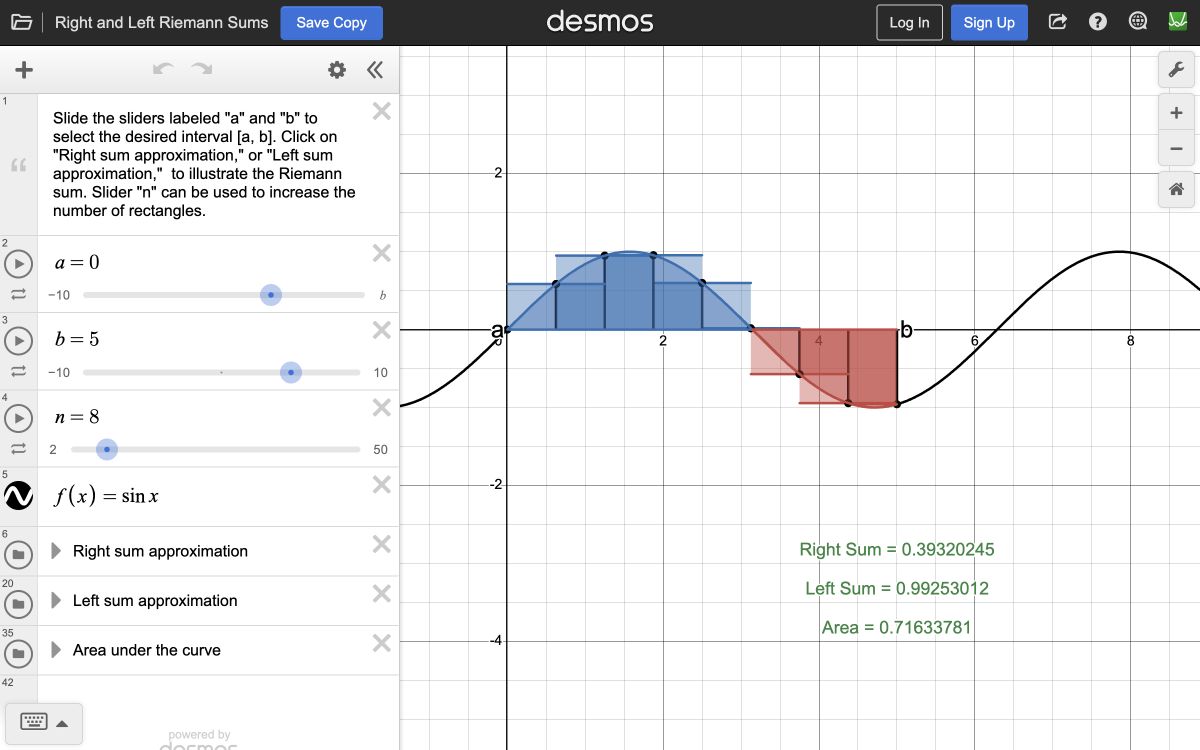
Contrast left- and right-endpoint estimates on the same function and interval.
 Open in Desmos ↗
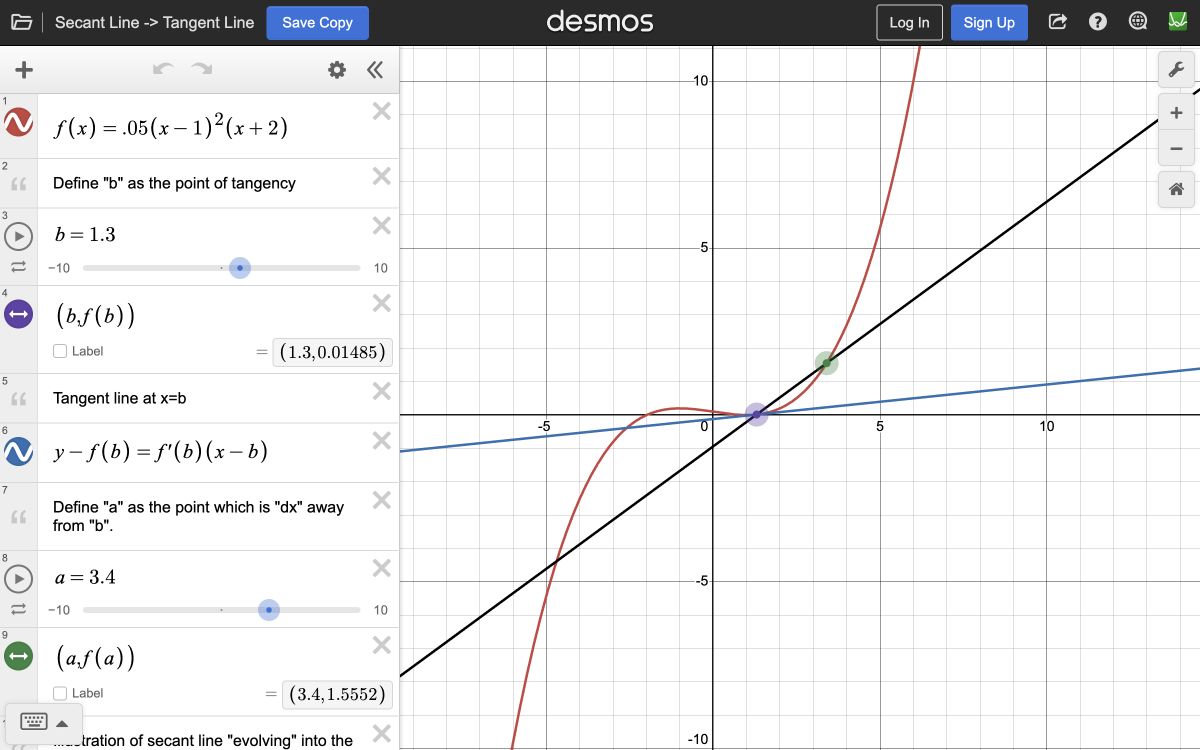
Watch a secant line approach a tangent line as the two points move together.
Interactive graph collection
 Open in Desmos ↗
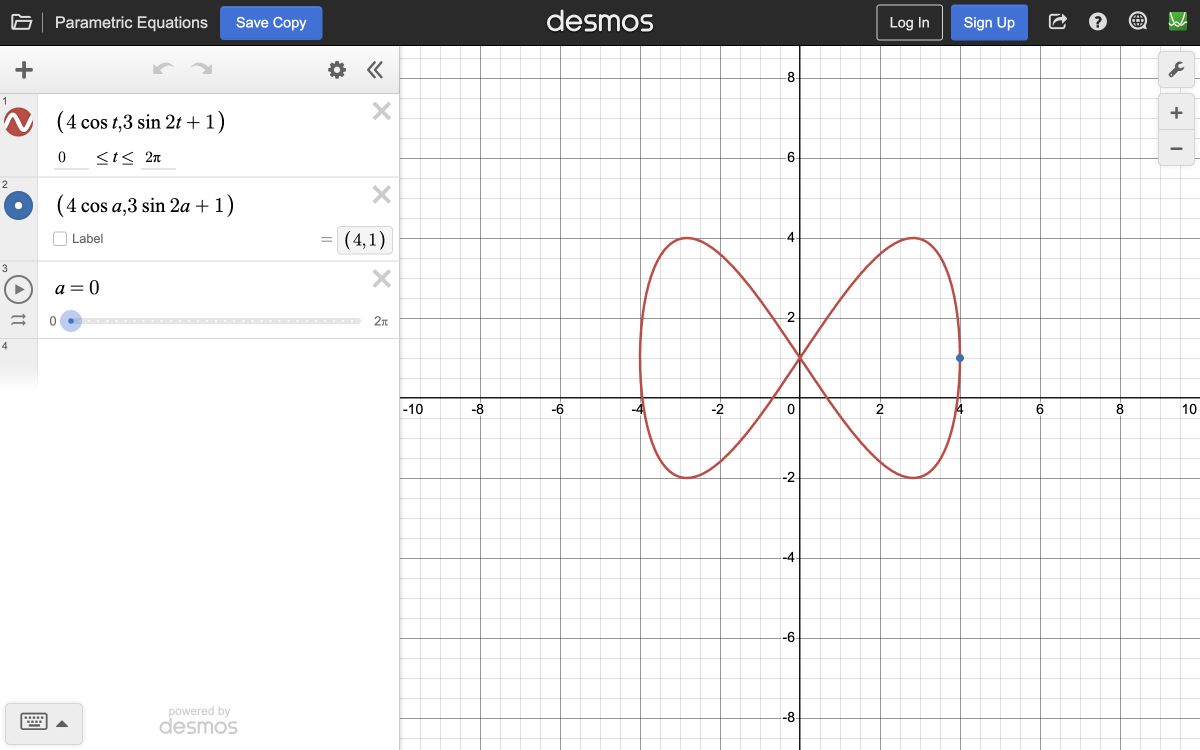
Trace a curve through paired coordinate functions and explore how the parameter shapes its path.